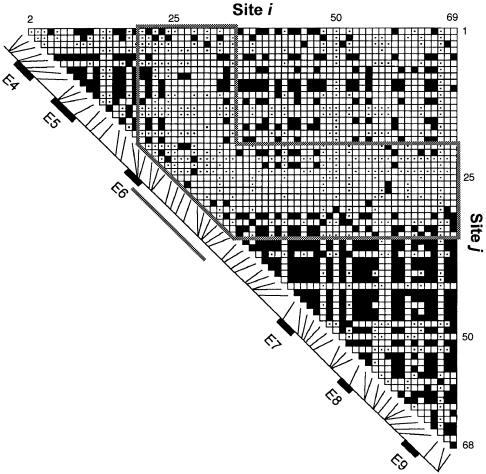
Figure 6.
Plot showing pairwise linkage disequilibrium, indicated by a blackened square, for site pairs with a significant Fisher's exact test (P<.001) and no correction for multiple comparisons. The labels on the X- and Y-axes indicate the site numbers, as given intable 1table 1. However, the numbers for sites 12 and 54 in table 1table 1 are not included, because their phasing was not determined. In comparisons of site pairs in which both sites have rare nucleotides, there can be complete disequilibrium (one of the four possible gametes having a count of 0)—yet the Fisher's exact test can be not significant. Site pairs that lack the power to test a significant association are indicated by a dot in the center of the square. The diagonal line, with exons 4–9 labeled, indicates the location of each varying site along the gene. The thick solid lines outline the maximal boundaries of the recombinational hotspot.

