
Figure 4.
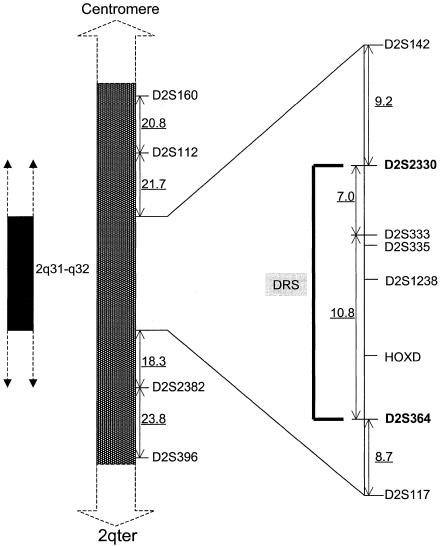
Schematic representation of the genetic map of the region containing the DRS locus. The flanking proximal and distal markers, separated by 17.8 cM, are shown in boldface. The distances (in cM) between the markers D2S160, D2S112, D2S142, D2S2330, D2S333, D2S364, D2S117, D2S382, and D2S396 are underlined. The order of and the genetic distances between markers were obtained from the PE Biosystems ABI PRISM mapping Web page.