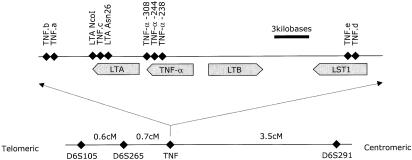
Figure 1.

Overview of TNF region: relative positions of the TNF microsatellites a–e and of the single-nucleotide polymorphisms of the TNFA and LTA genes and their promoters (top). The physical distances are approximate. Distances in the top panel are derived from GenBank record Y14768. The linkage map of the wider area (bottom) shows genetic map distances, as derived from the analyzed data set.
