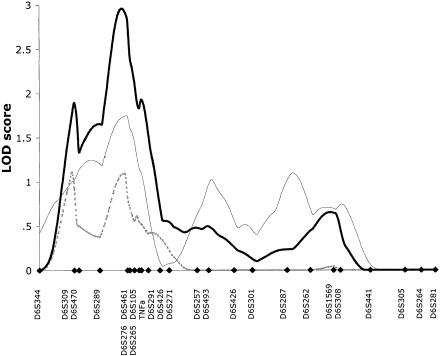
Figure 2.

Multipoint MLS curves for chromosome 6 from the basic family data set. Multipoint analyses were performed with use of the MAPMAKER/SIBS program. Results for CD (dashed line), UC (thin unbroken line), and ALL (thick unbroken line) are shown. Genetic distances between markers were estimated from the data set. Marker positions are denoted by blackened diamonds.
