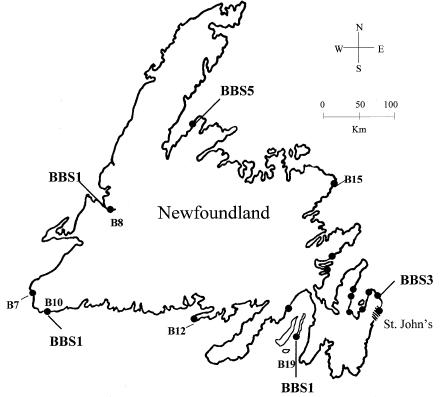
Figure 1.

Geographical distribution of 17 Newfoundland families with BBS (blackened circles), indicating linkage with BBS1, BBS3, or BBS5 as determined in previous studies (Woods et al. 1999; Young et al. 1999). The families genotyped in the present study are indicated by family number.
