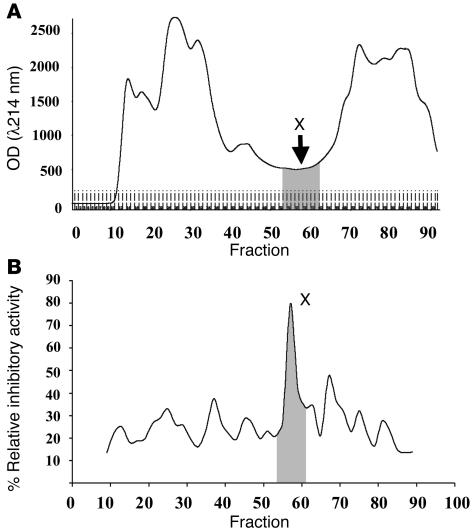
Figure 2.
Expression and functional profiles of anionic urinary proteins. (A) After completion of DEAE adsorption, anionic proteins were separated using HiLoad 16/60 Superdex 75 gel filtration, and peptides were quantitatively analyzed by spectrophotometry at λ214 nm. (B) The inhibitory activity against CaOx crystal growth of each fraction was measured (see Methods). Fraction X was a low abundant compartment but had a potent inhibitory activity. This pooled fraction was then separated by Resource Q anion exchange chromatography with a 0–0.5 M NaCl gradient elution (charge separation).

