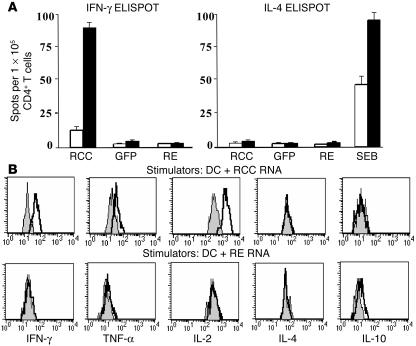
Figure 6.
In vivo induction and cytokine profile of RCC-specific CD4+ T cell responses. (A) CD4+ T cells were isolated from pre- (white bars) and post-vaccination (black bars) PBMC samples of 3 study subjects (representative data from patient RCC-01-DAB are shown) who received DAB389IL-2 (18 μg/kg) followed by vaccination with RCC RNA-transfected DCs (2 cycles of 1 × 10⁷ cells per treatment). Cells were stimulated for 18 hours with autologous PBMC RNA-, RE RNA-, or RCC RNA-transfected DCs. IFN-γ (left panel) or IL-4–expressing T cells (right panel) were enumerated using an automated ELISPOT reader, and antigen-specific T cell frequencies were expressed as the number of spot-forming cells per 1 × 10⁵ CD4+ T cells. Staphylococcal enterotoxin B (SEB) at a concentration of 10 μg/ml was used as a positive control in the IL-4 ELISPOT assays (right panel). (B) The cytokine expression profile of CD4+ T cells prior to (gray) and after (white) vaccination was measured after overnight (18 hours) stimulation with RCC (DC+RCC) or RE RNA-transfected DCs (DC+RE) using human Th1/Th2 cytometric bead arrays. Culture supernatants were used to determine expression of the Th-1 cytokines IFN-γ, TNF-α, and IL-2 as well as the Th-2 type cytokines IL-4 and IL-10.

