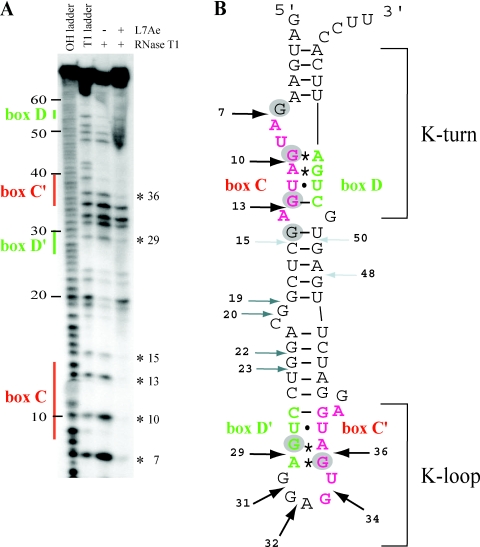
Figure 4.
(A) Footprint of L7Ae on sR47 using RNase T1. T1 and alkaline hydrolysis (OH) ladders as well as control without L7Ae were analyzed in parallel. The location of the major sequence features in sR47 is indicated to the left. The asterisks to the right indicate the position of G residues protected from RNase T1 cleavage by L7Ae. (B) Schematic representation of the RNase T1 footprinting results. The AG sheared base pairs are indicated by asterisks; the other non-canonical base pairs are indicated by dots. Strong, medium and weak RNase T1 cleavages in absence of L7Ae are denoted by black, dark gray and light gray arrows, respectively. G residues that are protected from RNase T1 cleavage by L7Ae are indicated by gray circles. The position of the K-turn and the K-loop are as indicated.

