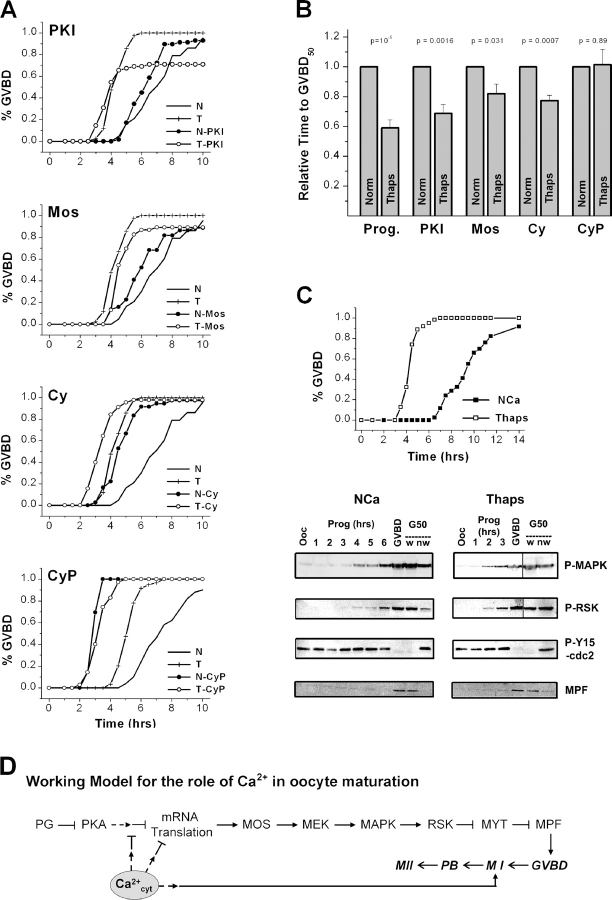
Figure 7.
Mapping the site of action of Ca 2+ cyt on meiosis entry. (A) GVBD time course for oocytes incubated in N-Ca solution (N), or L-Ca, and treated with thapsigargin (T). Oocyte maturation was induced with progesterone (N and T), PKI (PKI), Mos RNA 10 ng (Mos), cyclin B1 RNA 10 ng (Cy), or Δ87cyclin B1 protein ∼200 pg (CyP). (B) Relative time to GVBD50 normalized to GVBD50 in the N-Ca for each activator. P values are shown above the graph, n = 4–7. (C) Biochemical analysis of the cell cycle machinery. Maturation was induced as described in A and lysates were collected from immature oocytes (ooc), at hourly intervals after progesterone addition as indicated, at first GVBD (GVBD) and at GVBD50 (G50). For the GVBD50 time point we collected lysates form oocytes that have undergone GVBD (white spot, w) and those that have not (no white spot, nw). (D) Working model for the role of Ca2+ cyt in oocyte maturation/meiosis (see text for details). Dashed arrows indicated yet unknown steps in the cascade. The change in arrow shape and the bold font indicate transitions between the different stages of meiosis. M I, meiosis I; PB, polar body emission; M II, meiosis II.

