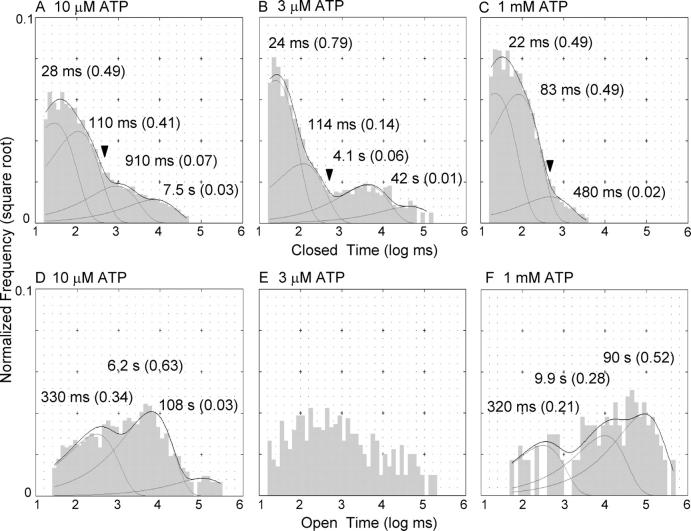
Figure 6.
Single-channel dwell time analysis of ΔR/E1371S-CFTR. (A) Events from two single-channel recordings (∼50 min each) were pooled together to construct this closed time histogram. The closed time distribution for data obtained at 10 μM ATP can be fitted with a quadruple exponential function. No cutoff was used for the construction of this histogram. The arrow marks the cutoff (500 ms) used to define the minimum of the ATP-dependent closed times used for the open time analysis in D. (B) The closed time distribution for data obtained at 3 μM ATP and fitting parameters. (C) Events from two recordings of single channels in the presence of 1 mM ATP were pooled together to construct this closed time histogram (∼100 min of recording). The closed time distribution can be fitted with a triple exponential function. No cutoff was used for the construction of this histogram. The arrow marks the cutoff used to construct the open time histogram shown in F. (D) The open time histogram for data obtained at 10 μM ATP shows the presence of three distinct burst lengths: a brief opening of 330 ms, an intermediate burst of 6 s (most of the events), and very few lock-open bursts with a time constant of ∼100 s. (E) The open time histogram for the recording at 3 μM ATP. (F) The open time histogram shows that most of the events are long-lived locked-open bursts (>50%).

