
Figure 3.
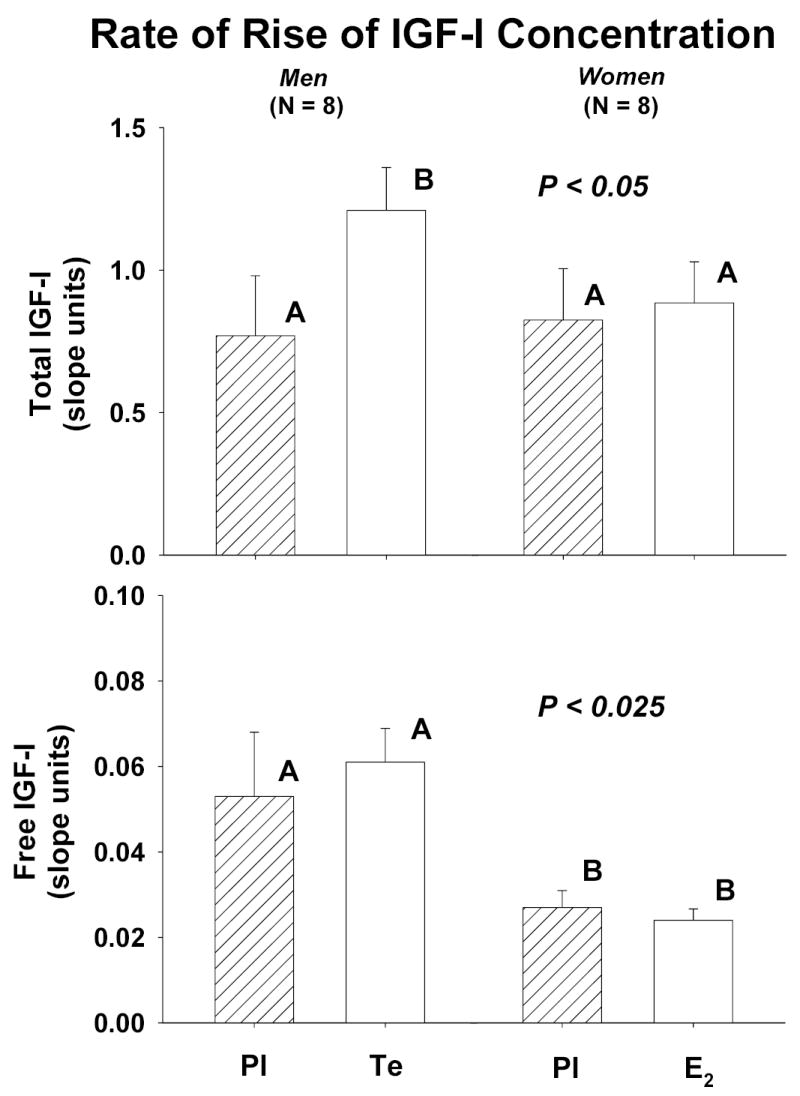
Initial rates of rise (slopes) of concentrations of total [top] and free [bottom] IGF-I concentrations over time during saline and rh IGF-I infusion in men and women pretreated with placebo (Pl), testosterone (Te) and estradiol (E2). Statistical representations are described in Figure 1.