
Figure 5.
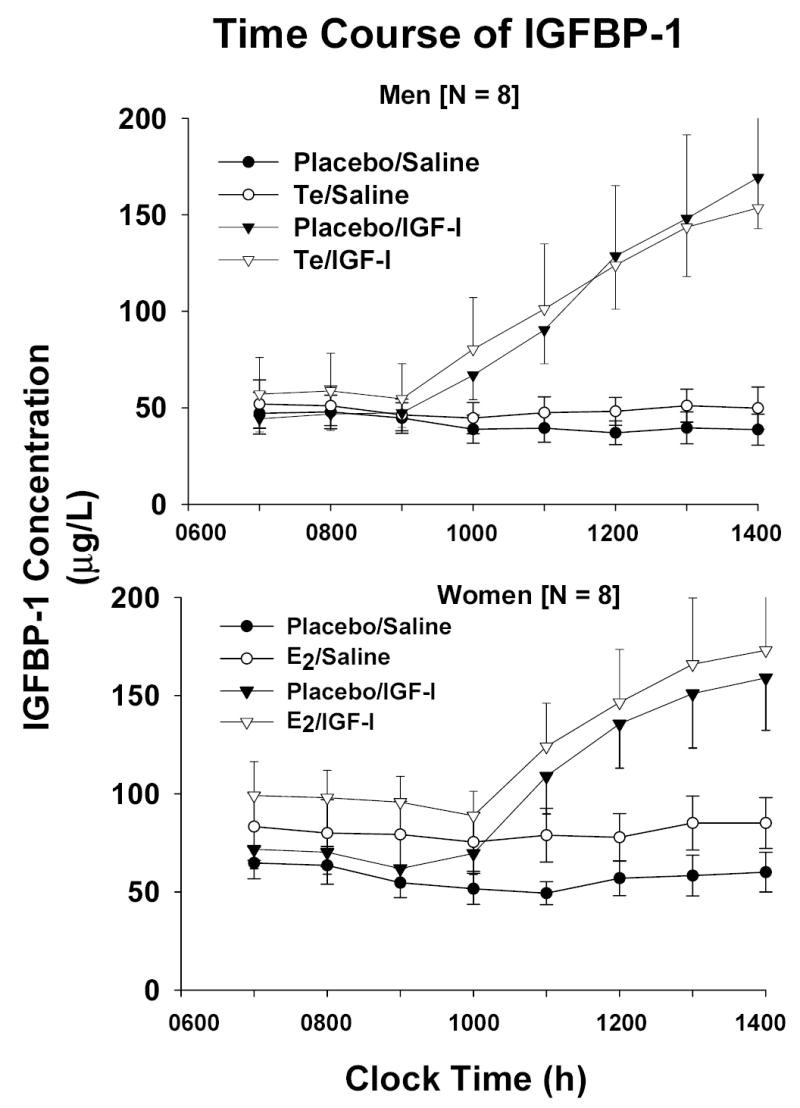
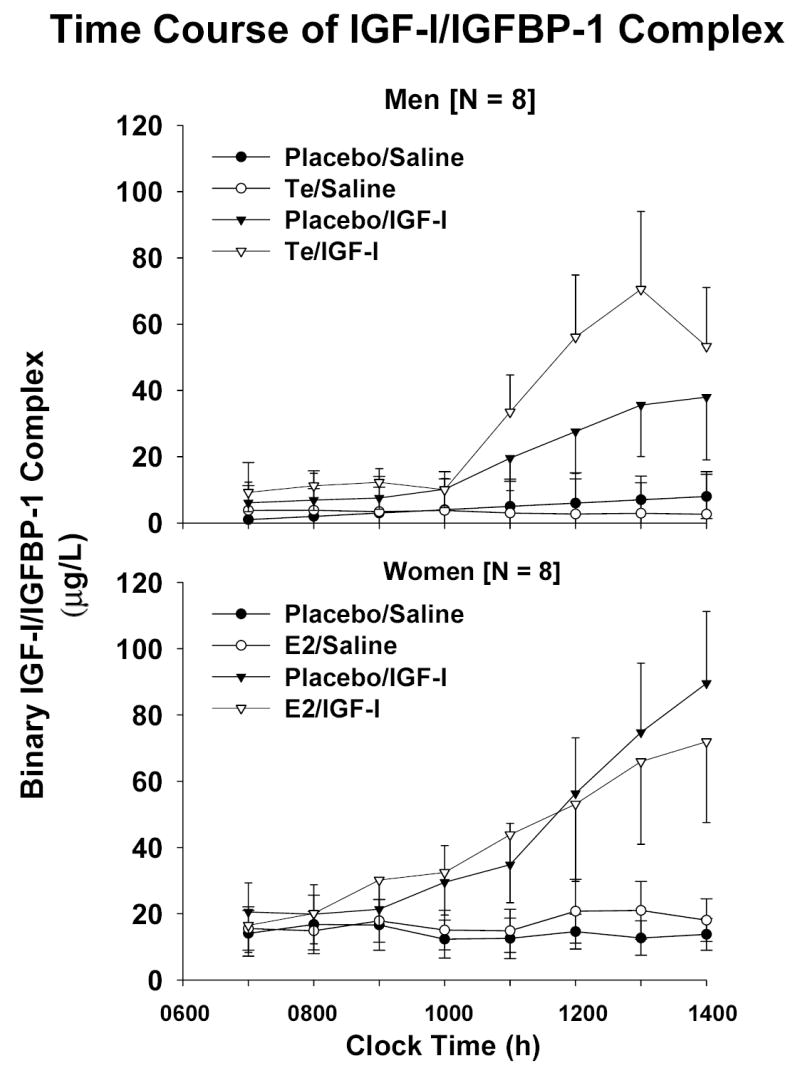
Time profiles of IGFBP-1 [Panel A] and binary IGF-I/IGFBP-1 [Panel B] concentrations during continuous iv infusion of saline vs rh IGF-I. Data are presented as described in the legend of Figure 2
Official websites use .gov
A
.gov website belongs to an official
government organization in the United States.
Secure .gov websites use HTTPS
A lock (
) or https:// means you've safely
connected to the .gov website. Share sensitive
information only on official, secure websites.
Time profiles of IGFBP-1 [Panel A] and binary IGF-I/IGFBP-1 [Panel B] concentrations during continuous iv infusion of saline vs rh IGF-I. Data are presented as described in the legend of Figure 2