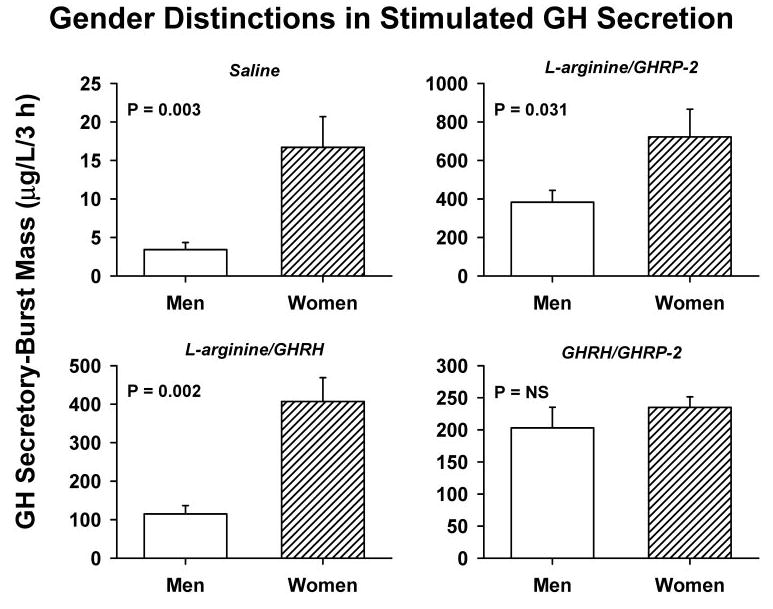
Fig. 3.

Mass of GH secreted in bursts over the 3-h interval after iv infusion of saline or paired secretagogues, as defined in Fig. 1. Data are the mean ± sem (P = NS denotes P > 0.05). The cohorts comprised eight men and six women. Statistical contrasts reflect ANCOVA followed by Tukey’s post hoc comparisons (Subjects and Methods).
