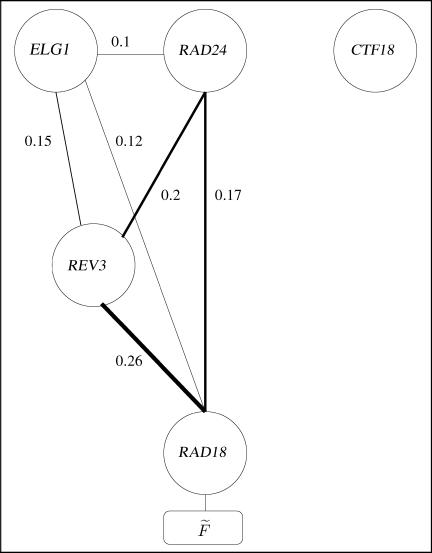
Figure 2. The FIN Diagram of the PRR Pathway.
Visualizes the compact performance function F˜ = e ⋅ (d ⋅ 0.26 + c ⋅ 0.17 + a ⋅ 0.12 + d ⋅ (c ⋅ 0.2 + a ⋅ 0.15) + (c ⋅ a) ⋅ 0.1), where a through e are Boolean variables representing the genes (a = ELG1, b = CTF18 , c = RAD24 , d = REV3, and e = RAD18 ). The investigated genes are represented as binary nodes whose state is determined according to the state of the corresponding genes in a given perturbation configuration, intact or knocked out. The nodes are connected with edges, their weight representing the functional influence between the two endpoint genes (the width of the edge is proportional to its weight). Given a knockout configuration, the expected performance level F˜ can be calculated by summing up the weights on the edges between intact nodes that form a connected component with the function node F˜. For example, in a mutant where both REV3 and ELG1 are knocked-out, the intact nodes are CTF18, RAD24, and RAD18. The edge RAD24–RAD18 is the resulting connected subgraph of F˜ predicting a performance level of 0.17. Observe that there are three main (two-node) pathways leading to F˜ , lines RAD24–RAD18 , ELG1–RAD18, and REV3–RAD18, where RAD18 is an essential gene in all of them. The RLC CTF18 has no significance in the FIN description even though it has a contribution of 4% (see Figure 1); it contributes marginally across many insignificant summands and does not play a significant role in any major one.

