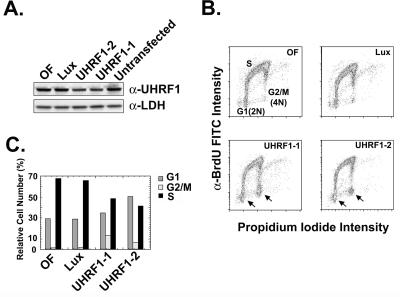
Figure 2.
Down-regulation of UHRF1 in H1299 cells results in G1 and G2/M cell cycle arrest. (A) Reduction of UHRF1 protein in H1299 cells treated with oligofectamine or transfected with siRNAs against either luciferase or UHRF1. Measurement was performed 24 h after transfection. Lactate dehydrogenase was used as the loading control. (B) Flow cytometric analysis of siRNA transfected H1299 cells pulsed with BrdU 72 h after transfection and then stained with FITC-conjugated α-BrdU and propidium iodide. DNA content is indicated on the x-axis and extent of BrdU incorporation is indicated on the y-axis. Arrows indicate increased G1 and G2/M phase cell populations for the UHRF1-transfected cells compared with the controls. Color coding in the plots goes in the order from blue to green to red, with red representing the highest cell density. (C) Graphical representation of flow cytometric data from B.

