Figure 2.
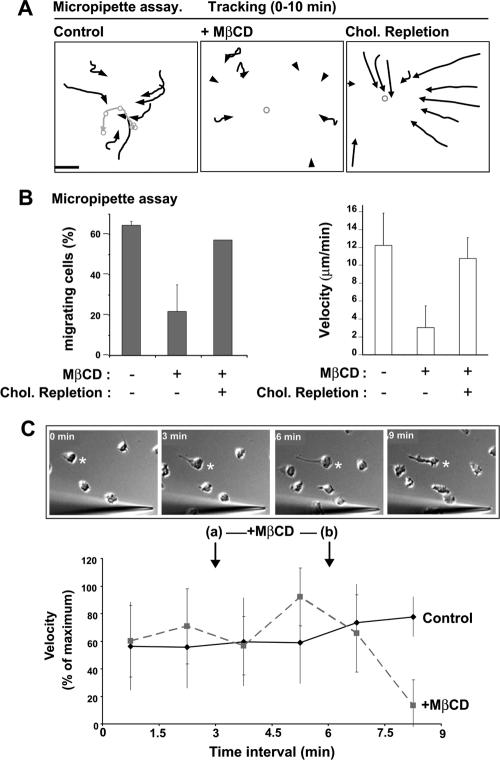
Cholesterol depletion inhibits the chemotaxis response. (A) Cell trajectories (black arrows) over a 10-min time course for control, MβCD-treated, or MβCD-treated and cholesterol-replenished cells stimulated with an fMLP-gradient diffusing from a micropipette (Supplementary Video 1). The gray circle/line indicates the positions of the micropipette. Data are representative of 2–5 separate experiments. Scale bar, 50 μm. (B) Graphs representing the percentage of cells able to migrate (left), and migration velocity (right) for control, MβCD-treated, or MβCD-treated and cholesterol-replenished cells stimulated for 10 min by an fMLP gradient diffusing from a micropipette. Data are mean ± SD for 2–3 independent experiments. (C) Effect of treating cells with MβCD after polarization in response to an fMLP-gradient. At t = 3 min (a), MβCD-free media was replaced with the same media or media containing MβCD (2.5 mM). At t = 6 min (b), media was replaced again with MβCD-free media. (Bottom) Graph showing the average velocity of control and MβCD-treated cells at time intervals of 1.5 min. Results are expressed as percentage of the maximum speed (mean ± SD, 3 independent experiments). Top, time-lapse DIC images of a representative migrating cell (asterisk) that exhibits a collapse in polarity 1 min after the end of MβCD treatment. Scale bar, 10 μm.

