Figure 3.
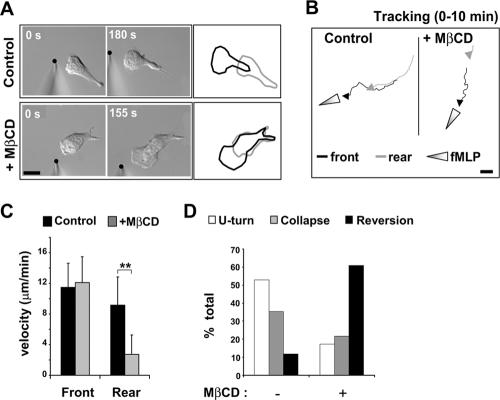
Cholesterol is required for the function of the uropod. (A) DIC images of control and MβCD-treated dHL-60 cells responding to a point source of fMLP (black dot). Outlines of the cells at the start (gray) and the end (black) of the time course reveal the migration response. (B) Tracking analysis of the front and rear edges of a control cell and an MβCD-treated cell stimulated with an fMLP-gradient for 10 min. Scale bar, 10 μm. (C) Quantification of the velocity of the front and rear edges of control and MβCD-treated cells. Results are expressed as mean ± SD for three independent experiments (n = 21 for control cells, n = 18 MβCD-treated cells). Differences between front and rear velocity were statistically significant according to the Student's t-test (** p < 0.01). (D) Graph representing the percentage of cells that display a U-turn, a collapse of polarity, or a reversion of polarity after a sudden inversion of the chemoattractant gradient (n = 17 control cells and n = 23 for MβCD-treated cells in 3 separate experiments; see also Supplementary Figure S2 and Supplementary Video 2).

