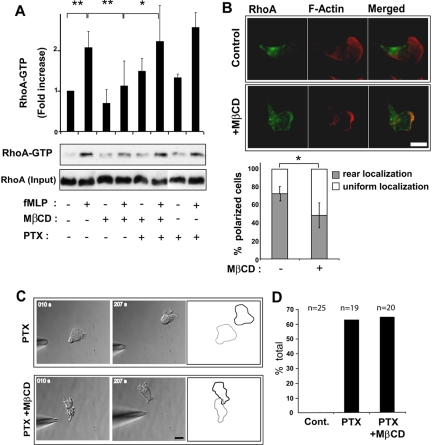
Figure 4.
Cholesterol facilitates RhoA activation indirectly through an effect on the Gi pathway. (A) Measurement of RhoA-GTP levels in control dHL-60 cells, MβCD-treated cells, MβCD-treated and pertussis toxin (PTX; 1 μg/ml, overnight)-treated cells and PTX-treated cells after stimulation with uniform fMLP, monitored by GST-Rhotekin-RBD pulldowns and Western blotting. The graph represents a quantification of densitometry results expressed as fold increase in RhoA-GTP compared with resting conditions (mean ± SD, 3–5 separate experiments). Differences between fMLP-treated versus resting control cells, fMLP- versus fMLP/MβCD-treated cells (** p < 0.01) and fMLP/MβCD- versus fMLP/PTX/MβCD-treated cells (* p < 0.05) were statistically significant according to the Student's t-test. (B) Fluorescence images of RhoA and F-actin in a control and MβCD-treated cell stimulated with uniform fMLP (100 nM, 2 min). Scale bar, 10 μm. The graph represents the percentage of polarized cells exhibiting rear or uniform RhoA distribution. Results are expressed as mean ± SD for three experiments (n = 182 control cells and n = 184 MβCD-treated cells). Differences between control and MβCD-treated cells were statistically significant according to the Student's t-test (* p < 0.05). (B) Time-lapse DIC images of fMLP-induced uropod formation in PTX- or PTX/MβCD-treated dHL-60 cells. Cell outlines represent the starting (gray) and the ending (black) positions of the cell during the time course. Scale bar, 10 μm. (D) Graph representing the percentage of control (cont.), PTX-treated cells and PTX/MβCD-treated cells that formed a retracting uropod facing the pipette tip.

