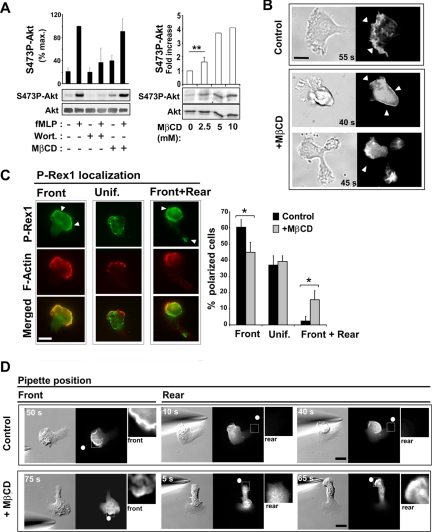
Figure 5.
Cholesterol is critical for restricting D3-PI distribution to a single membrane area. (A, left panel) Measurement of Ser473P-Akt levels by Western blotting and densitometry analysis in the absence or presence of MβCD (2.5 mM, 3 min), wortmannin (70 nM, 2 h), and fMLP (1 μM, 1 min). Akt levels in each sample were also measured by Western blotting to provide an input control. The graph represents results from densitometry analysis expressed as a percentage of maximum Ser473P-Akt levels for control cells (mean ± SD for 5 separate experiments). (A, right panel) Levels of S473P-Akt were measured after subjecting resting cells to cholesterol depletion with the indicated concentrations of MβCD for 3 min. The graph represents results expressed as the fold increase in the level of Ser473P-Akt compared with control conditions (mean ± SD for 2–3 separate experiments). (B) DIC and fluorescence images of cells expressing PH-Akt-GFP after stimulation with uniform fMLP. (Top) A control polarized cell (Supplementary Video 3). (Bottom) Two different MβCD-treated cells, one of which is transiently polarized (top; Supplementary Video 4) and one of which is unable to polarize (bottom; Supplementary Video 5). Arrowheads indicate the PH-Akt-GFP membrane staining. Scale bar, 10 μm. (C) Fluorescence images of P-Rex1 and F-actin in polarized cells uniformly stimulated with fMLP. Arrowheads indicate P-Rex1 membrane staining. The graph represents the percentage of polarized cells exhibiting one of three P-Rex1 localization patterns: front, uniform, or front plus rear. Results are expressed as mean ± SD for three independent experiments (n = 114 control cells, n = 113 MβCD-treated cells). Differences were statistically significant according to the Student's t-test (* p < 0.05). (D) DIC and fluorescence images of control and MβCD-treated cells expressing PH-Akt-GFP, after gradient inversion (Supplementary Videos 6 and 7). Arrowheads indicate PH-Akt-GFP membrane staining. Insets represent a 3× magnification of the area delimited by the white square. The white dots indicate the position of the micropipette tip. Scale bar, 10 μm.

