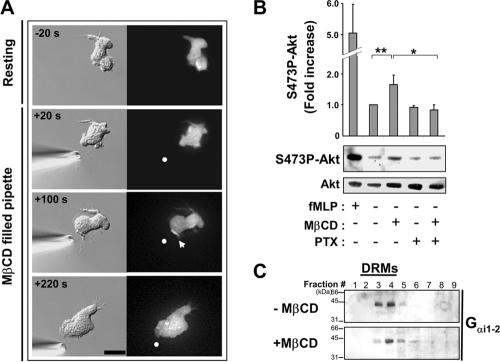
Figure 6.
Cholesterol depletion induces pseudopod formation in a PI3-K- and Gi-dependent manner. (A) DIC and fluorescence images showing the response of a PH-Akt-GFP-expressing cell to cholesterol depletion using a micropipette filled with 2.5 mM MβCD (Supplementary Video 8). The arrowhead indicates PH-Akt-GFP membrane staining, and the dot indicates the position of the micropipette tip. Scale bar, 10 μm. (B) Measurement of Ser473P-Akt levels by Western blotting and densitometry analysis in the absence or presence of MβCD (2.5 mM, 3 min), pertussis toxin (PTX; 1 μg/ml, overnight), and fMLP (1 μM, 1 min). Akt levels in each sample were also measured by Western blotting to provide an input control. The graph represents results from densitometry analysis expressed as the fold increase compared with control resting conditions (mean ± SD for 5 separate experiments). Differences between resting versus MβCD-treated (** p < 0.01), and MβCD- versus MβCD/PTX-treated cells (* p < 0.05), were statistically significant according to the Student's t-test. (C) Distribution of Gαi1–2 across fractions of sucrose density gradient loaded with lysates from control and MβCD-treated cells, revealed by Western blotting using an anti-Gαi1–2 antibody.

