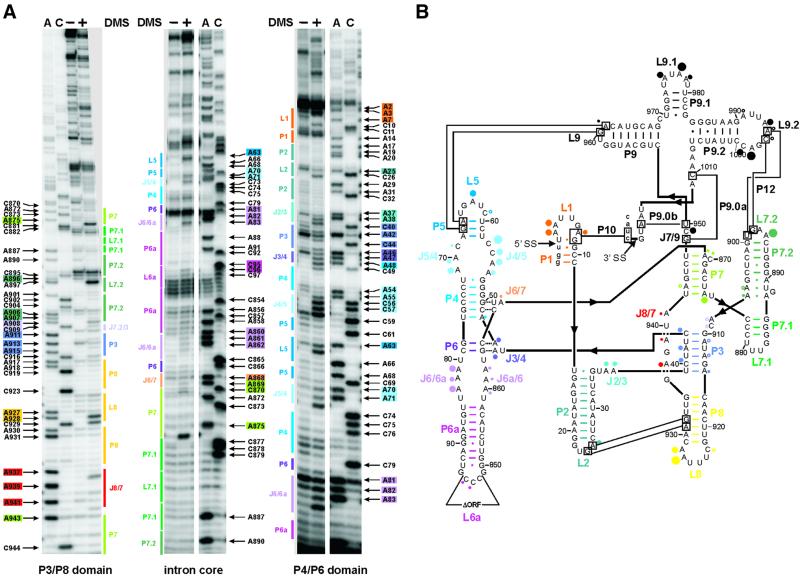
Fig. 1. DMS modification of the td intron in vivo. (A) Intron residues accessible to DMS are displayed in these representative gels. Boxed nucleotides correspond to positions within the intron, which are modified by DMS. The P3-P8 domain of the intron core (left panel), the center of the intron core covering the P7 stem, as well as the P6-P6a element (middle panel) and the P4-P6 domain of the intron core and the stem–loops P1-P2 (right panel) are shown. The following color code is used: P1, orange; P2, turquoise; P3, blue-violet; P4 and P5, blue; P6 extension, purple; P7 extension, green; P8, yellow; and J8/7, red. (A) and (C) denote the sequencing lanes. (B) Summary of the td intron residues modified by DMS in vivo. Modified sites are indicated by dots. The size of the dots correlates with the relative modification intensities. The largest dot corresponds to the highest modification intensity [color code for the dots as in (A); modifications in P9 are represented by black dots]. This structure representation is based on that of Cech et al. (1994).

An official website of the United States government
Here's how you know
Official websites use .gov
A
.gov website belongs to an official
government organization in the United States.
Secure .gov websites use HTTPS
A lock (
) or https:// means you've safely
connected to the .gov website. Share sensitive
information only on official, secure websites.
