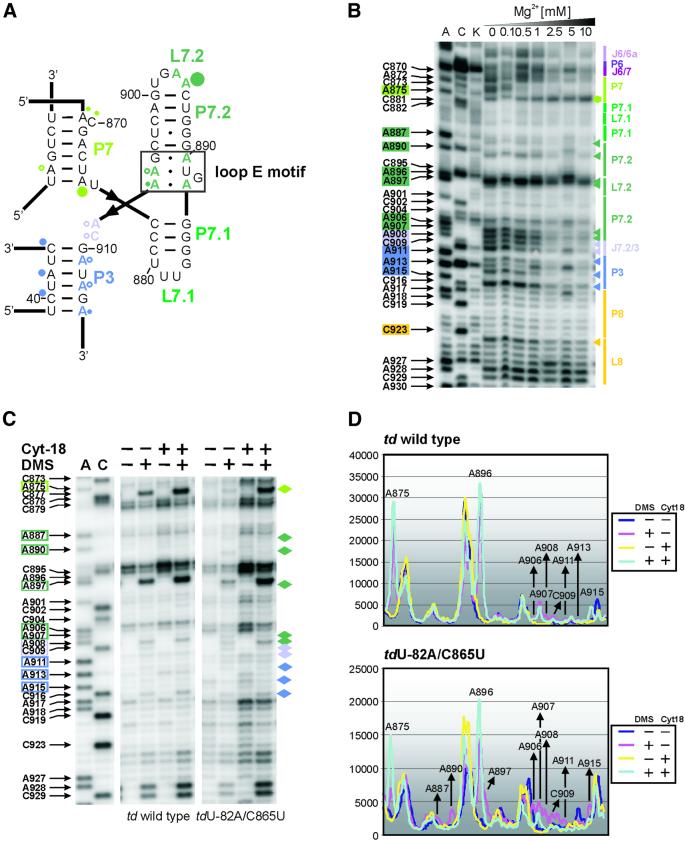
Fig. 4. Perturbation of the loop E motif. (A) The loop E motif of the P7.1-P7.2 extension of the td group I intron (boxed in black). The modified residues are labeled with dots whose size correlates to the relative modification intensities within the wild-type intron (color code as in Figure 1). (B) In vitro DMS modification of the ribozyme td WT-12 with increasing magnesium concentrations. Junction J6/6a to stem P8 is displayed. The increasing magnesium concentrations are indicated also. Boxed nucleotides on the left side of the gel correspond to positions within the intron whose DMS modification intensity changes with increasing magnesium concentration. The colored triangles represent a decrease in accessibility to DMS, whereas the green hexagon corresponds to an increased accessibility to DMS with increasing magnesium concentration. The color code is as in Figure 1. (C) The representative gels display the modification status of residues which are part of or close to the loop E motif in the context of the wild-type intron and of the mutant tdU-82A/C865U, in the absence and presence of the group I intron-specific splicing factor Cyt-18. The nucleotide numbering highlighted with colored boxes as well as the colored diamonds outline those residues whose accessibility was altered due to the mutation in stem P6. (D) Quantification of the modification intensities in the absence and presence of Cyt-18. The upper panel depicts the relative change in modification intensities of residues that are part of, or that are close to, the loop E motif within the wild-type intron, and in the lower panel within the mutant tdU-82A/C865U. Due to increased levels of td RNA in cells co-expressing Cyt-18, these differences were normalized (see Materials and methods).

An official website of the United States government
Here's how you know
Official websites use .gov
A
.gov website belongs to an official
government organization in the United States.
Secure .gov websites use HTTPS
A lock (
) or https:// means you've safely
connected to the .gov website. Share sensitive
information only on official, secure websites.
