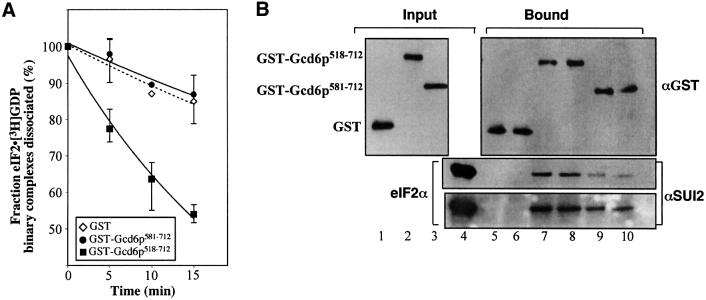
Fig. 4. In vitro analysis of GST-tagged fragments of eIF2Bε (Gcd6p). (A) Nucleotide exchange activity of GST fusion proteins shown as rate of removal of [3H]GDP from eIF2 binary complexes. Four micrograms of each protein was used. GST (diamonds) GST–Gcd6p518–712 (squares) and GST–Gcd6p581–712 (circles). Error bars show standard deviations, trendlines are exponential curve fits to the data, broken line is for GST alone. (B) Interaction of eIF2 (20 nM) with GST fusion proteins (4 µg each, ∼200 nM GST or ∼100 nM Gcd6p518–712) using glutathione–Sepharose chromatography. Proteins indicated on the left were assessed by western blotting using the antisera indicated on the right of each panel. Lanes 1–3, 0.25 µg input GST fusion proteins; lane 4, 1 µg input eIF2; lanes 5–10, upper panel, 10% of bound material loaded, lower panels, 55% of bound material loaded. The bottom panel is a longer exposure of the same experiment shown in the middle panel.

An official website of the United States government
Here's how you know
Official websites use .gov
A
.gov website belongs to an official
government organization in the United States.
Secure .gov websites use HTTPS
A lock (
) or https:// means you've safely
connected to the .gov website. Share sensitive
information only on official, secure websites.
