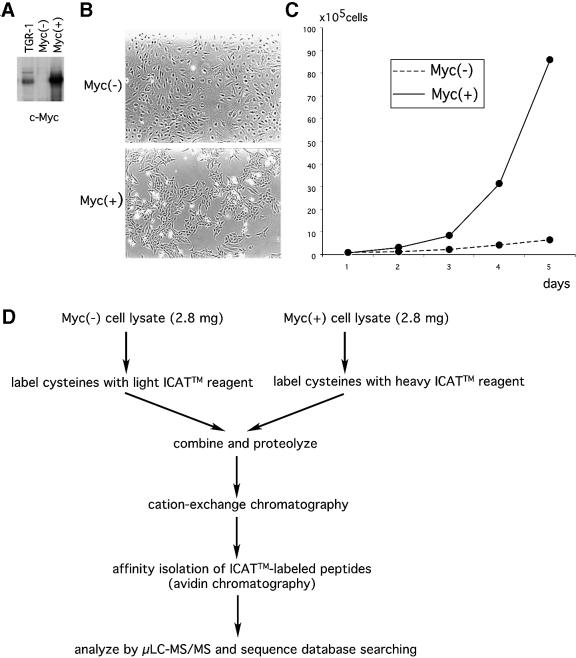
Fig. 1. Quantitative proteomic analysis of Myc(–) and Myc(+) cells. (A) Expression of the c-Myc protein in parental TGR-1, Myc(–) and Myc(+) cells. Thirty micrograms of each whole-cell lysate was analyzed by anti-c-Myc immunoblotting. (B) Morphology of Myc(–) and Myc(+) cells. (C) Proliferation of Myc(–) and Myc(+) cells. Cells were plated at a density of 1 × 10⁵ cells per 10-cm plate and the mean cell numbers of duplicate plates were determined every 24 h. (D) Outline of ICAT™ reagent labeling procedure.

An official website of the United States government
Here's how you know
Official websites use .gov
A
.gov website belongs to an official
government organization in the United States.
Secure .gov websites use HTTPS
A lock (
) or https:// means you've safely
connected to the .gov website. Share sensitive
information only on official, secure websites.
