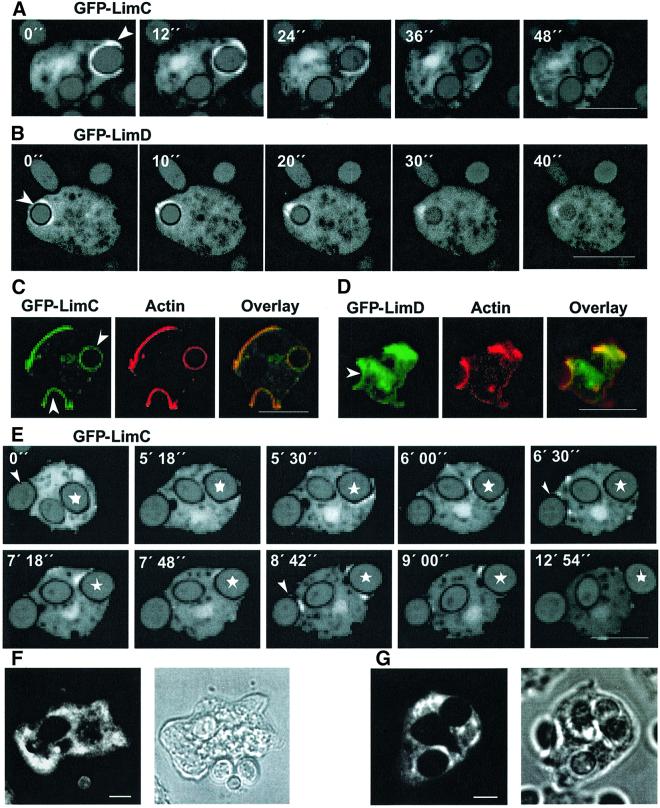
Fig. 5. LimC and LimD in phagocytosis and exocytosis. (A and B) Dynamics of GFP–LimC and GFP–LimD redistribution during phagocytosis. GFP–LimC (A) or GFP–LimD (B) expressing cells were incubated with TRITC-labeled, heat-killed yeast cells. Confocal sections were taken at the times indicated. Arrowheads in the 0 s panel (A and B) mark the site of formation of the phagosomes. Bars, 10 µm. (C and D) Co-localization of GFP–LimC and GFP–LimD with actin at the phagocytic cups. GFP–LimC (C) or GFP–LimD (D) expressing cells were incubated for 10 min with heat-killed yeast cells and labeled after methanol fixation with anti-actin monoclonal antibody. Fluorescence patterns of the GFP–LimC (C) and the GFP–LimD (D) fusion proteins at the phagocytic cups as well as the cell cortex coincide with actin staining (overlay). The arrowheads in the GFP panels mark the position of the yeast cell being phagocytosed. Bars, 10 µm. (E) Dynamics of GFP–LimC redistribution during exocytosis. GFP–LimC cells were incubated with TRITC-labeled, heat-killed yeast cells for ∼1 h. Confocal sections were obtained after every 6 s. Selected images are shown. Asterisks (in all the frames) mark the yeast cell of interest and the arrowhead (in 0 s panel) marks the yeast that the cell is trying to phagocytose. Note the accumulation of GFP–LimC around the exocytotic vacuole as the cell prepares for exocytosis of the phagocytosed yeast (marked with an asterisk). Arrowheads in 6 min 30 s and 8 min 42 s panels show the simultaneous accumulation of GFP–LimC fusion protein on the phagocytic cup. Bar, 10 µm. Localization of endogenous LimC (F) and LimD (G) during uptake of yeast particles. Fixation and immunofluorescence detection with the respective monoclonal antibodies was carried out as for Figure 3. The corresponding phase-contrast images are shown. Bars, 5 µm.

An official website of the United States government
Here's how you know
Official websites use .gov
A
.gov website belongs to an official
government organization in the United States.
Secure .gov websites use HTTPS
A lock (
) or https:// means you've safely
connected to the .gov website. Share sensitive
information only on official, secure websites.
