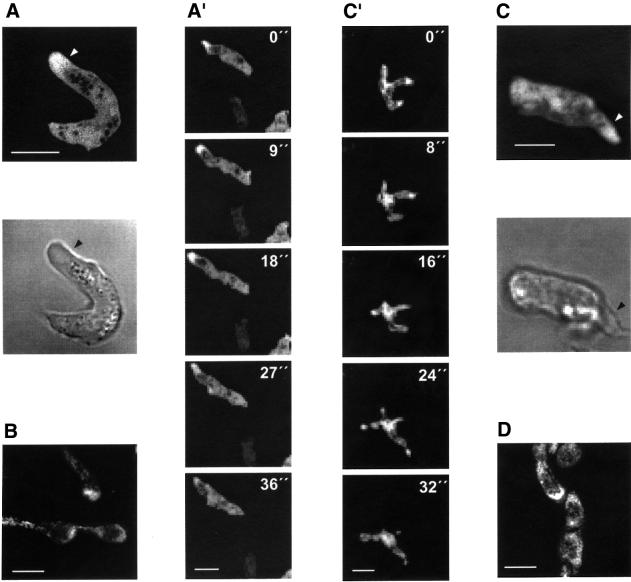
Fig. 6. LimC and LimD during cell motility. Cells starved for 6 h aggregate and, in general, acquire an elongated shape with a well-defined front and tail. Fluorescence images of aggregation-competent GFP–LimC (A) and GFP–LimD (C) cells and their respective phase-contrast images are shown. The arrows point to an extending pseudopod. Time series of aggregation-competent GFP–LimC (A′) and GFP–LimD (C′) expressing cells, which are rapidly extending pseudopods. Confocal images were taken at the times indicated. Both GFP–LimC and GFP–LimD accumulate to high levels in the pseudopods, as do endogenous LimC (B) and LimD (D) in aggregating AX2 cells. Detection was as described in Figure 5. Bars, 10 µm.

An official website of the United States government
Here's how you know
Official websites use .gov
A
.gov website belongs to an official
government organization in the United States.
Secure .gov websites use HTTPS
A lock (
) or https:// means you've safely
connected to the .gov website. Share sensitive
information only on official, secure websites.
