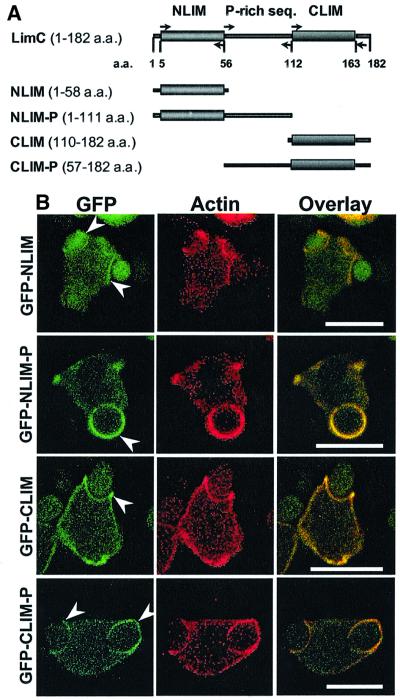
Fig. 7. Localization of N- and C-terminal LimC deletion products. (A) Schematic representation of terminally deleted LimC proteins used for localization studies. Domain organization of LimC is shown. NLIM and CLIM represent the N- and C-terminal LIM domain, respectively. ‘P-rich seq.’ represents the intervening region between the two LIM domains that is rich in proline residues. Arrows indicate the position and orientation of oligonucleotide primers used for amplification. (B) Distribution of GFP–NLIM, GFP–NLIM-P, GFP–CLIM and GFP–CLIM-P during phagocytosis. Cells expressing these proteins exhibit a fluorescence pattern that is identical to that of the parent GFP–LimC fusion protein (see Figure 5C). All the truncated GFP fusion proteins accumulate at the phagocytic cup (arrowheads) during uptake of the yeast cell and their fluorescence pattern coincides with actin staining (overlay). Bars, 10 µm.

An official website of the United States government
Here's how you know
Official websites use .gov
A
.gov website belongs to an official
government organization in the United States.
Secure .gov websites use HTTPS
A lock (
) or https:// means you've safely
connected to the .gov website. Share sensitive
information only on official, secure websites.
