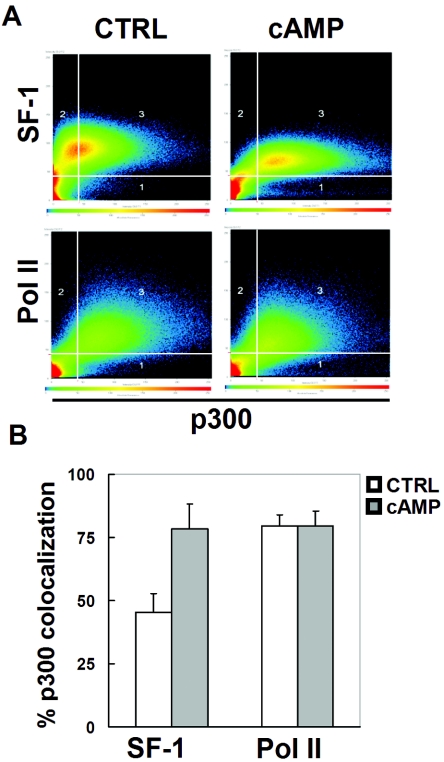
FIG. 7.
cAMP increases colocalization of SF-1 and p300. (A) Y1 cells were treated without (control [CTRL]) or with 1 mM 8-Br-cAMP for 6 h. Fixed cells were labeled with antibodies against p300 and SF-1 (top) or RNA Pol II (bottom). After confocal laser scanning microscopy, the scatter diagrams for each staining were generated and are shown. The thresholds for scoring p300, SF-1, or Pol II staining as positive are shown as vertical or horizontal lines in each panel. Area 3 in each scatter plot represents pixels showing strong staining for both p300 and SF-1 (Pol II). (B) Measurement of p300 colocalization with SF-1 or Pol II. Eighteen cells were randomly selected and analyzed in four separate immunostaining experiments in the absence (CTRL) or presence of 1 mM 8-Br-cAMP treatment. The percentages of SF-1 or Pol II colocalization with p300, calculated by computer software, are presented.

