FIG. 2.
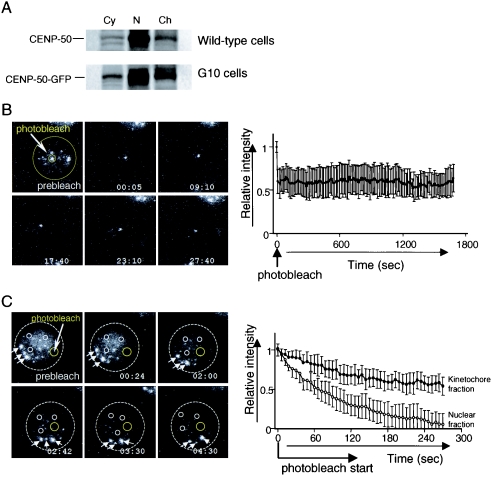
CENP-50 stably associates with the centromere. (A) Cytoplasmic, nuclear soluble, and chromatin fractions were prepared from wild-type and G10 cells (in which the expression of CENP-50 is replaced with that of CENP-50-GFP) and separated by SDS-PAGE. Western blotting analysis was performed with anti-CENP-50 antibody. The banding pattern of wild-type cells is similar to that of G10 cells, which were used for photobleaching experiments. (B) Images of iFRAP experiments and quantification of iFRAP kinetics. With the exception of a small region of the centromere (small circle), the entire G10 cell (big circle) expressing CENP-50-GFP was photobleached with a laser, and images were collected by fluorescence time-lapse microscopy for 30 min. Images before (prebleach) and after bleaching of a typical cell are shown. The average of the relative intensity is plotted with the standard deviation. The fluorescence intensity of unbleached regions for CENP-50-GFP was essentially unchanged. (C) FLIP analysis. A small region of nucleus (yellow circle) was photobleached repeatedly. The fluorescence intensity in the nucleoplasm (small white circle) and in the centromere region (arrows) was measured. The average relative intensity is plotted with standard deviation. The fluorescence intensity of CENP-50-GFP in the nucleoplasm (small white circles) decreased more rapidly than that in the centromere region (arrows).

