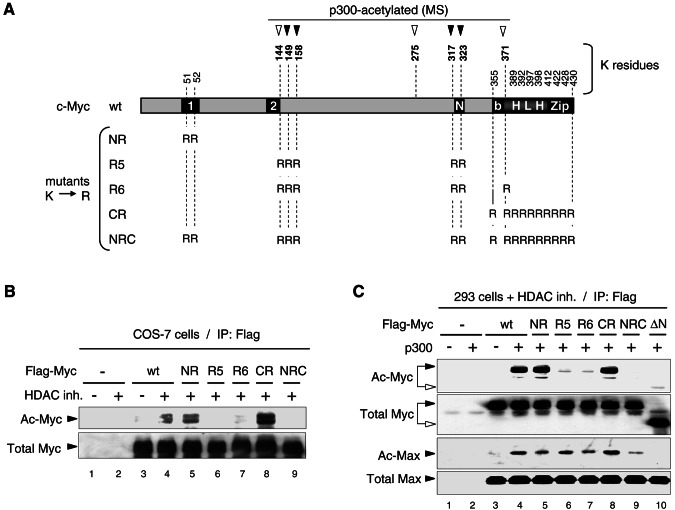
FIG. 4.
Mapping p300-acetylated Myc residues in mammalian cells by mass spectrometry and site-directed mutagenesis. (A) Diagram of mouse c-Myc wt indicating seven lysine residues acetylated by p300 in vitro (arrowheads; see reference 37 and additional data in the supplemental material). Filled arrowheads indicate those lysine residues acetylated by p300 in HEK293 cells and mapped by MS/MS (see text and mass spectra in the supplemental material). The lysine-to-arginine (K→R) substitution mutants used below are indicated. Boxes 1 and 2 are MB1 and MB2. “N” is a nuclear localization signal. (B) Analysis of Flag-Myc wt and K→R mutants in transfected COS-7 cells treated (+) or mock treated (−) with HDAC inhibitors (HDAC inh.). Equal amounts of immunoprecipitated Flag-Myc wt and mutants were analyzed by Western blot as in Fig. 3C. Acetylated (Ac-Myc) and total Flag-Myc (Total Myc) is indicated. (C) HEK293 cells transfected with Flag-Myc wt or the indicated K→R and Δ1-110 (ΔN) mutants, and with p300 (+) or the empty vector (−) were treated with HDAC inhibitors and equal amounts of immunoprecipitated (IP: Flag) Flag-Myc proteins were analyzed by Western blot as described above. Endogenous Max coimmunoprecipitated with Flag-Myc proteins was analyzed on the same blot with the acetyl-K antibody (Ac-Max) and with Max (C-124) antibody (Total Max).

