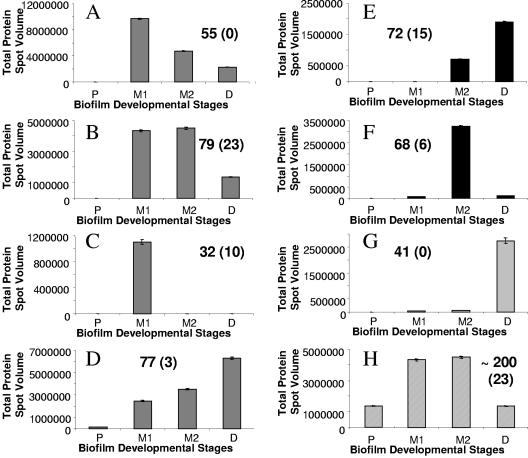
FIG. 1.
Protein production patterns A to H over the course of biofilm development. The production pattern analysis was carried out from 2D images that were scanned using a calibrated image scanner (GE Healthcare). Image analysis was done using Image Master 2D Platinum software (GE Healthcare). Computational analysis was based on 2D protein spot volumes. Four biofilm developmental stages previously described by Sauer et al. (52) were thus analyzed: P, planktonic cell stage; M1, maturation-1 stage (3-day-old biofilms); M2, maturation-2 stage (6-day-old biofilms); and D, early dispersion stage (9-day old biofilms). The data shown here represent average spot volumes for all proteins belonging to distinct protein production patterns. Experiments were carried out in triplicate for each growth stage.

