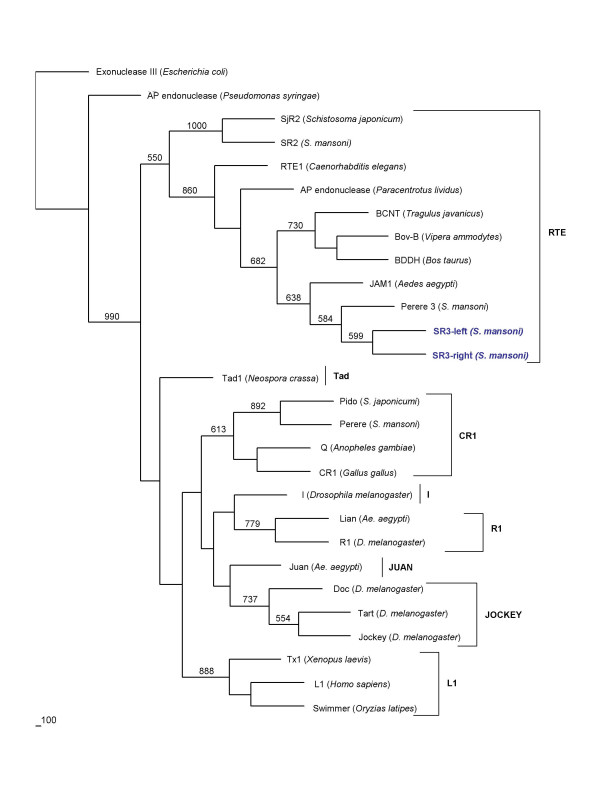
Figure 3.
Phylogram constructed using the neighbor-joining method to compare the relationships among endonucleases of SR3 and of representative elements belonging to the major clades of non-LTR retrotransposons [25] from a range of host genomes. Representatives of eight major clades of non-LTR retrotransposons including the RTE, L1, CR1, Jockey, and I clades were included in the analysis. Bootstrap values of 500 or greater from 1,000 replicates are presented at the nodes.

