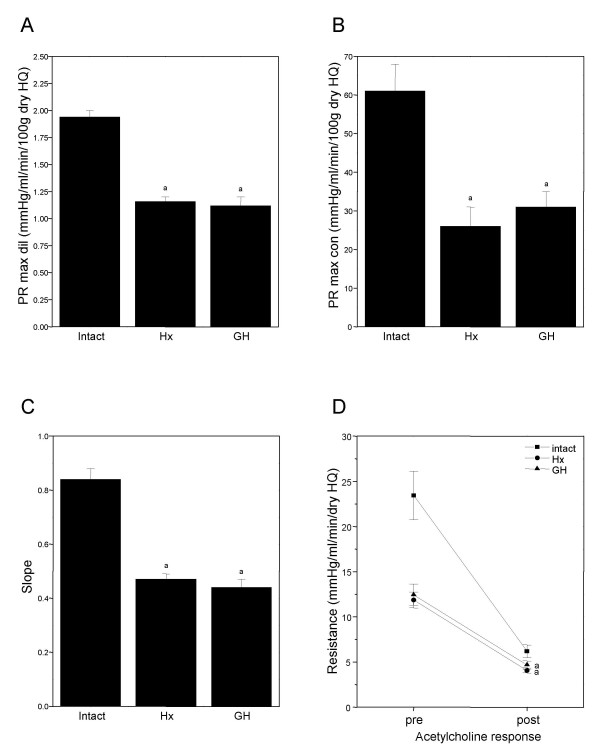
Figure 6.

Graphs A-C showing the effect of hypophysectomy (Hx) and 14 days of growth hormone substitution to Hx rats (GH) on structural properties and acetylcholine response (D) in the skeletal vascular bed. (A) Graphs showing the perfusion resistance (PR) at maximal dilation (max dil), reflecting the average internal radius of the skeletal vasculature. (B) Graph showing the PR at maximal constriction (max con) obtained by barium chloride, reflecting average medial bulk of contractile tissue. (C) Graph showing slope, calculated by linear regression from individual pressure-flow curves during perfusion at maximal dilation. (D) Linear graph showing the resistance pre (during maximal noradrenaline constriction) and post (after a single dose of acetylcholine) in the skeletal vascular bed, reflecting the endothelial function. *indicate p < 0.05 between intact and GH or Hx rats.
