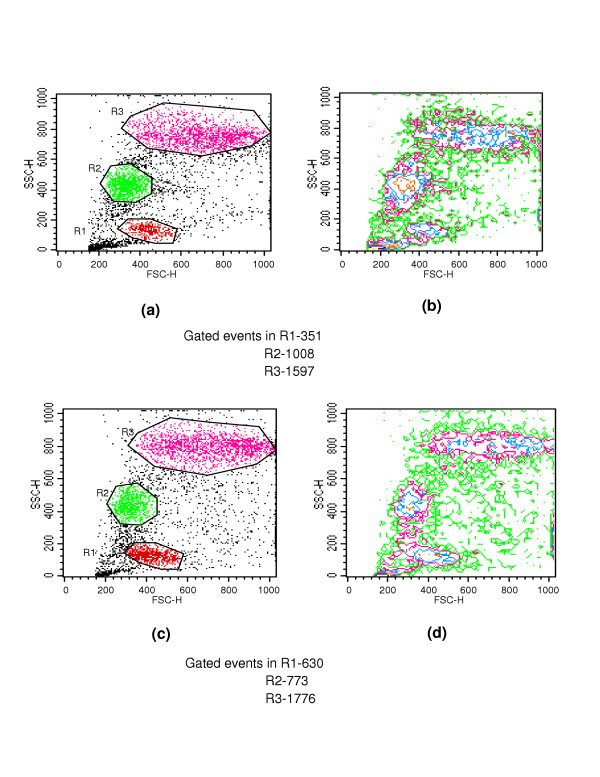
Figure 1.
Three populations R1, R2 and R3 in forward (FSC, voltage E00) and side scatter (SSC, voltage 340) of intra-uterine stages; two representative worms by Flow cytometry are shown: 1a and 1c – Dot plots; 1b and 1d – respective contour maps; the number of events in individual gates for IU stages are indicated below respective figures.

