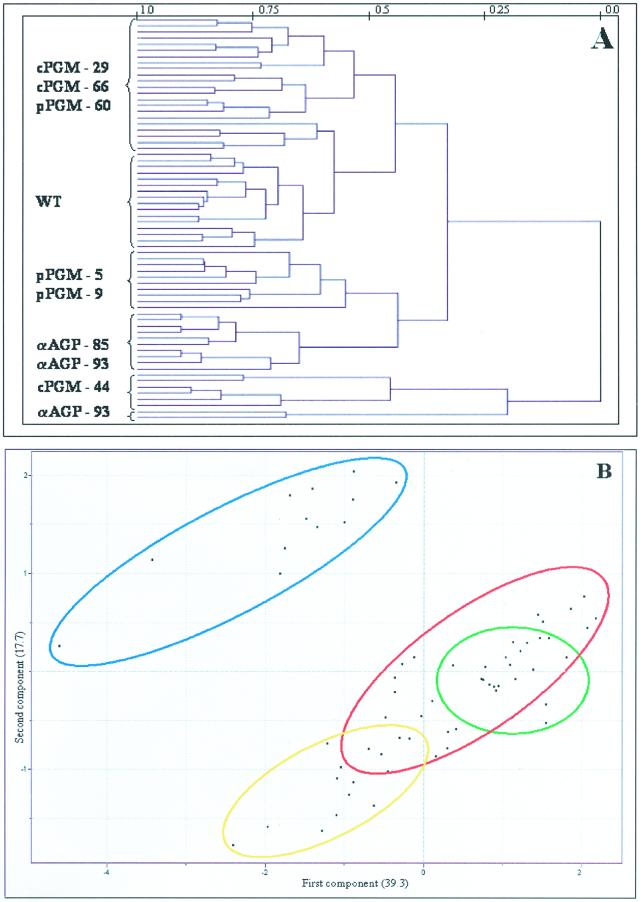
Figure 4.
A, Dendogram obtained following HCA of the metabolic profiles of the genetically modified potato systems impaired in starch synthesis. Wherever possible, individual branches are grouped in brackets for ease of reading. B, PCA of the metabolite profiles of the genetically modified potato systems impaired in starch synthesis. Samples representing wild type (green circle), pPGM (yellow circle), cPGM tubers (red circle), and AGPase tubers (blue circle) are marked as described for ease of comparison. PCA vectors 1 and 2 were chosen for best visualization of differences between experimental treatments and include 57.0% of the information derived from metabolic variances.

