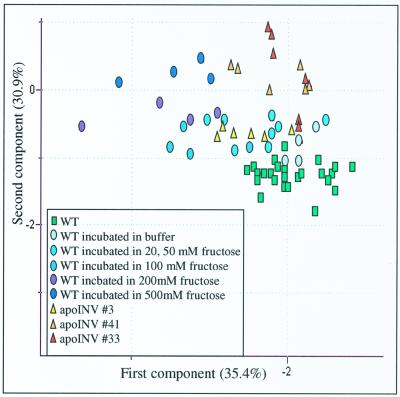
Figure 6.
PCA of the metabolic profiles of wild-type potato tubers, Fru-fed tuber discs, and apoplastic invertase-expressing tubers. PCA vectors 1 and 2 were chosen for best visualization of differences between experimental treatments and include 53.3% and 65.4% of the information derived from metabolic variances, respectively.

