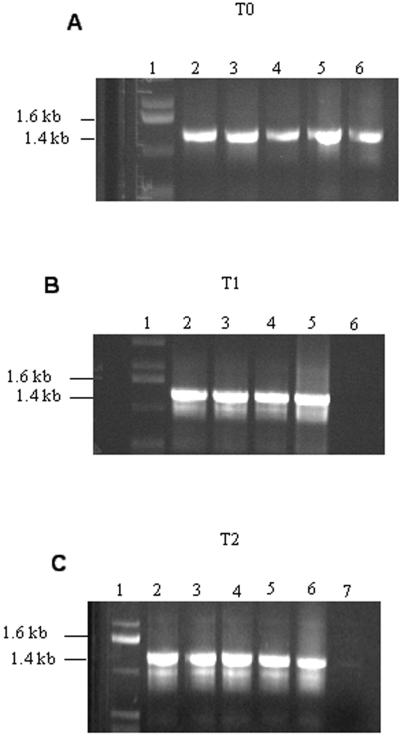
Figure 3.
PCR analysis of plant DNA. DNA extracted from T0 (A), T1 (B), and T2 (C) plants were run on a 0.8% (w/v) agarose gel. A, T0, lane 1, 1-kb ladder; lanes 2 through 5, transgenic lines; lane 6, MSI-99 plasmid. B, T1, lane 1, 1-kb ladder; lanes 2 through 4, transgenic; lane 5, plasmid control; lane 6, wild-type plant DNA. C, T2, lane 1, 1-kb ladder; lanes 2 through 5, transgenic; lane 6, plasmid control; lane 7, wild-type plant DNA.

