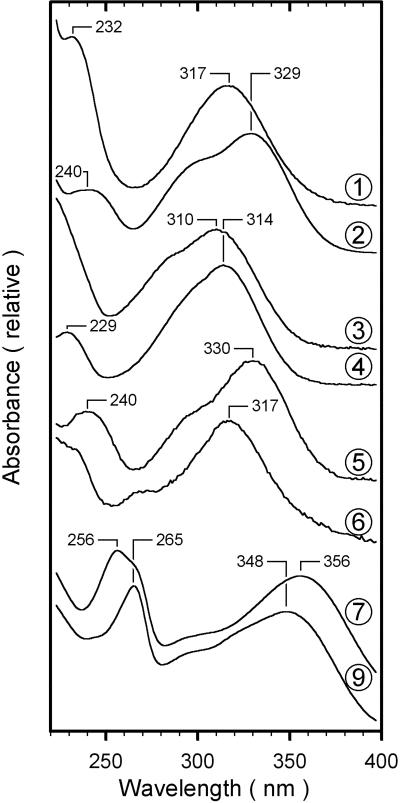
Figure 3.
Absorbance spectra of phenolic compounds. The absorbance spectra of chromatographically detected compounds, normalized to their long-wavelength maximum, are shown. Numbers identifying spectra refer to the peak numbers in Figure 2. The spectrum of compound 7 was indistinguishable from that of compound 8; the spectra of compounds 9 and 10 were also indistinguishable.

