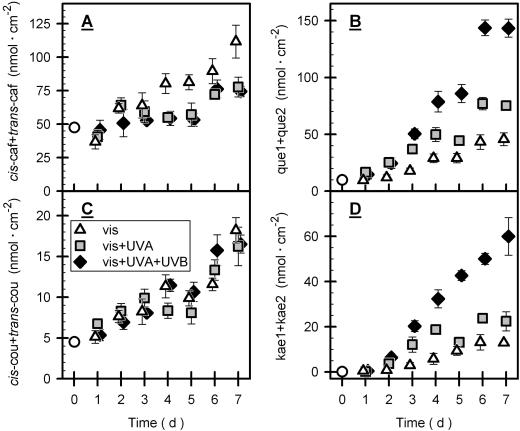
Figure 4.
Concentration of phenolics during outdoor exposure. The figure depicts concentrations, normalized to leaf area, of the sum of cis- and trans-caffeoyl tartaric acid (A), and cis- and trans-coumaroyl tartaric acid (C) during exposure of grape leaves to different light conditions as defined in Figure 1. Data, normalized to leaf area, for quercetin (que1 + que2) and kaempferol (kae1 + kae2) are shown in B and D, respectively. que1 and que2 stand for HPLC peaks 7 and 8 (Fig. 2) representing different quercetin glycosides, and kae1 and kae2 correspond to peaks 9 and 10 (Fig. 2) representing different kaempferol glycosides. Here, and also in subsequent figures, triangles, squares, and diamonds symbolize data obtained under vis, vis + UVA and vis + UVA + UVB conditions, respectively. The white circles denote the initial data from greenhouse-grown vines measured immediately before outdoor exposure. For clarity, symbols of identical time intervals were slightly shifted relative to each other. Bars indicate ses of means (4 ≤ n ≤ 6). In the cases of small ses, bars are hidden by symbols. In A, vis data differed significantly those of the other treatments; in B and D, vis + UVA + UVB data differed significantly from those of the other treatments (see “Materials and Methods”).

