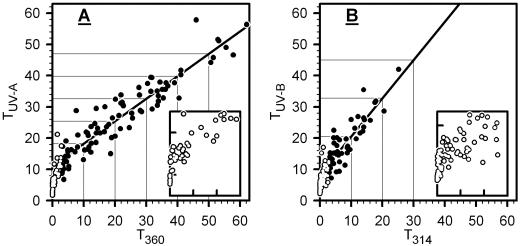
Figure 7.
Relation between epidermal screening and UV absorption of phenolics. Data of individual leaves are shown. In A and B, we plot epidermal transmittance for UV-A radiation (TUV-A) against transmittance of extracted leaf phenolics at 360 nm (T360), and epidermal UV-B transmittance (TUV-B) against transmittance of extracted leaf phenolics at 314 nm (T314), respectively (extracted phenolics correspond to peaks 1–10 in Fig. 2). In A and B, the bold line results from linear regression to solid circles, that is for T360 > 3% and T314 > 3%. In A and B, coefficients of determinations are r2 = 0.874 and r2 = 0.750, and equations resulting from regression analyses are TUV-A = 11 + 0.72 × T360 and TUV-B = 8 + 1.22 × T360, respectively. White circles (T360 or T314 < 3%) are also shown at amplified scales in inserts (ordinate, 0%–12%; abscissa, 0%–3%).

