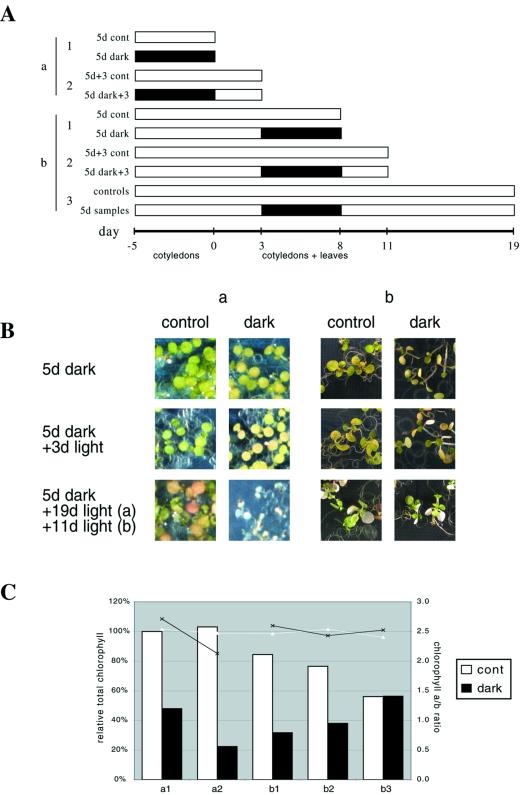
Figure 4.
Darkened seedlings. A, Time course of the experiments. Seedlings were grown on plates, and transferred to darkness and returned to the light as indicated. White segments indicate time in light and dark segments indicate time in darkness. Each bar represents a sample that was harvested at the indicated time. The first group of seedlings to be placed in the dark (a) had only cotyledons. The second group (b) had both cotyledons and primary leaves. B, Photographs of representative seedlings. The bottom row were all taken on d 19, when the “a” samples had been returned to light for 19 d and the “b” samples had been returned to light for 11 d. C, Total chlorophyll (expressed as a percent of d-0 controls) and chlorophyll a/b ratios of the seedlings.

