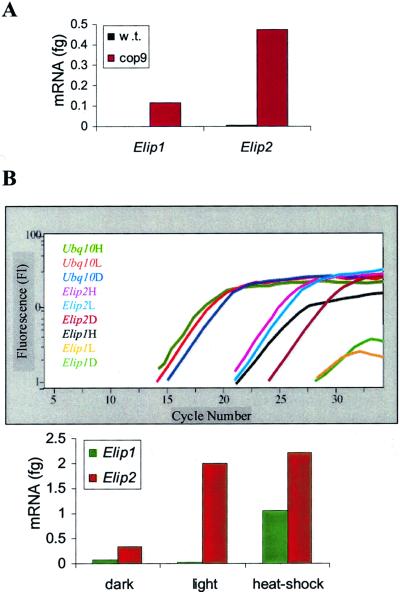
Figure 4.
Analysis of Elip in downstream light-signaling mutants. A, RT-PCR analysis of Elip expression in cop9. RNA was isolated from 4-d-old dark-grown Arabidopsis wild-type (w.t.) and cop9 seedlings. One-tenth of the cDNA was amplified by the LightCycler using Elip1, Elip2, and ubq10 primers. The normalized initial amounts of Elip1 and Elip2 are shown. B, RT-PCR analysis of Elip expression in hy5. Four-day-old hy5 dark-grown seedlings were kept in the dark (D) or exposed to 1 h of white light (L) or to heat shock (H) before total RNA extraction. One-tenth of the cDNA was amplified by the LightCycler. Amplification curves of Elip1, Elip2, and Ubq10 are shown in the graph, with normalized initial amounts of Elip1 and Elip2 mRNA presented in the bar graph. Error bars represent sd based on three replicates of the same sample.

