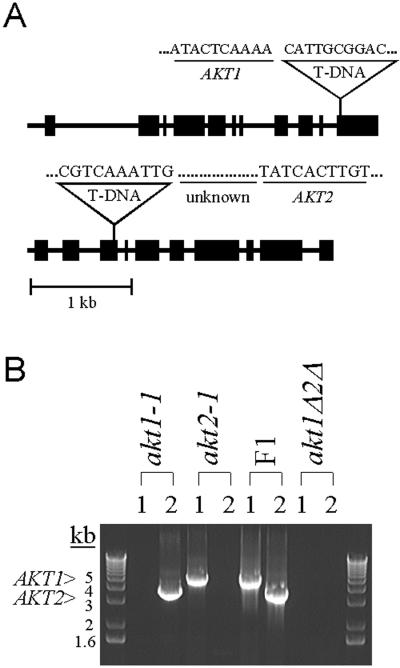
Figure 1.
T-DNA insertion mutations in the AKT1 and AKT2 genes, and the construction of a double mutant. A, Schematic diagrams of the akt1-1 and akt2-1 alleles indicating locations of the T-DNA insertions and sequences of the gene/T-DNA junctions. Forty-nine bases of unknown origin separate the T-DNA border and AKT2 sequence. Large and small boxes represent exons and introns, respectively. T-DNA is not drawn to scale. B, Identification of single and double mutants in a segregating population by analysis of PCR products. Ethidium bromide-stained gel showing the presence or absence of AKT1 and AKT2 PCR products in akt1-1 and akt2-1 parents, the F1 heterozygote, and F2 akt1Δ2Δ double mutant. Lanes marked 1 should not contain a product if the akt1-1 T-DNA insert was present. Lanes marked 2 should not contain a product if the akt2-1 T-DNA insert was present. The double mutant lacked both wild-type genes.

