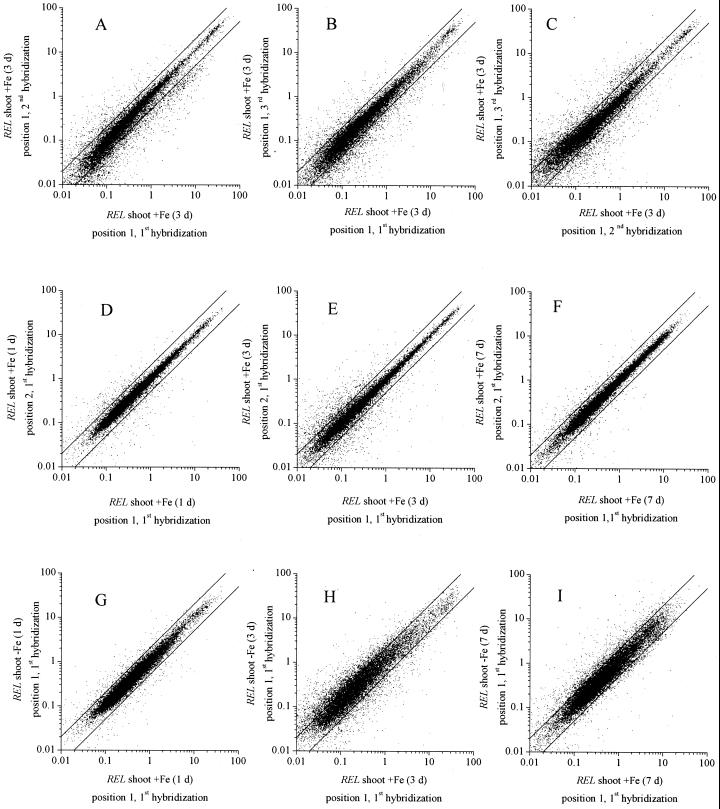
Figure 1.
Scatter plot analysis of signal variability. The effect of different factors on signal variation was analyzed: repetition of hybridization (A–C), position on the filter (D–F), and Fe deficiency (G–I). Quantified and normalized signals were expressed as REL of control shoot (+Fe) and test shoot (−Fe) arrays after 1 d −Fe (D and G), 3 d −Fe (A–C, E, and H), and 7 d −Fe (F and I). To analyze the influence of hybridization repetitions on signal variation, control shoot REL (3 d −Fe) of different hybridizations were scattered: first versus second (A), first versus third (B), and second versus third (C) hybridization. cDNA clones were doubly spotted on filters at position 1 and 2. To exclude position-induced signal variation, REL at position 1 were compared. Position-induced REL variation is shown in D through F. REL of doubly spotted cDNA clones of one filter were scattered: position 1 versus 2. Data of control shoot arrays after 1, 3, and 7 d of −Fe (D–F, respectively) of the first hybridization are given as an example. The influence of Fe deficiency on REL is presented in G through I (1, 3, and 7 d −Fe, respectively). Shoot control (+Fe) versus shoot test (−Fe) arrays were compared. REL variations due to hybridization repetition and position on the filter were excluded using REL of the first hybridization and at position 1. For comparison of signal variation, guide lines were added to figures (y = 2x, y = x/2).

