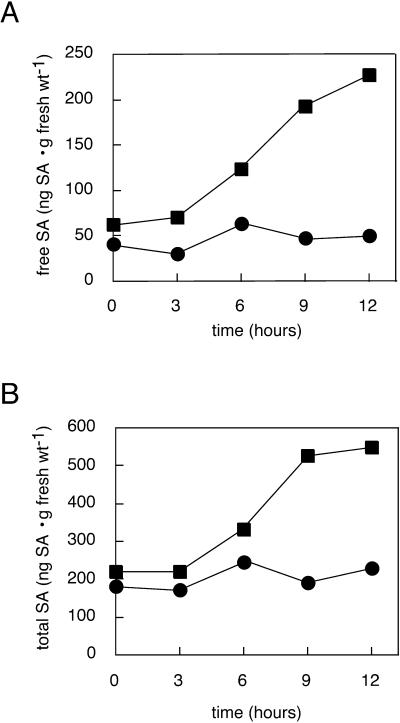
Figure 5.
UV-C-elicited SA production in ndr1-1 versus Columbia. Tissue was harvested from ndr1-1 (circles for data points) or Columbia (squares for data points) plants at the indicated times following a 10 min of exposure to UV-C light. Free (A) and total (B) SA content of the samples were quantitated. To achieve maximum precision with respect to time of sampling, only one sample was taken for each time point. As such, no error bars are shown. Similar results were obtained in replicate experiments.

