Figure 7.
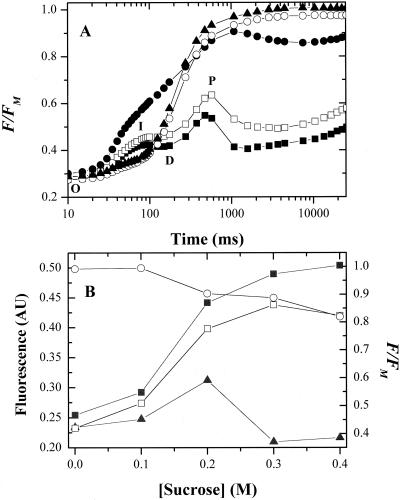
Effects HOS on chlorophyll a fluorescence induction curves. A, Cells were dark adapted for 20 min in TAP medium containing no Suc (black squares), 0.1 (white squares), 0.2 (black circles), 0.3 (white circles), or 0.4 (black triangles) m Suc. Chlorophyll a fluorescence yield changes were measured under continuous illumination. In each case, curves were normalized to the maximum fluorescence (Fm) of the corresponding treatments containing 10 μm atrazine. Fluorescence yield, expressed in units of fractional fluorescence, F/Fm, is plotted against time after the start of illumination. B, The dependence on Suc concentration of steady-state (taken at 16.5 s after onset of illumination) variable fluorescence levels, presented in arbitrary units, steady-state fluorescence level (Fs, white squares) and maximum fluorescence levels (Fm, white circles). The steady-state fluorescence yield is also depicted; Fs normalized to Fm (black squares), expressed in fractional fluorescence units, F/Fm. Also shown is the dependence of fluorescence yield at the peak of phase I (taken at 90 ms after the start of illumination), Fi, normalized to Fm (black triangles).

