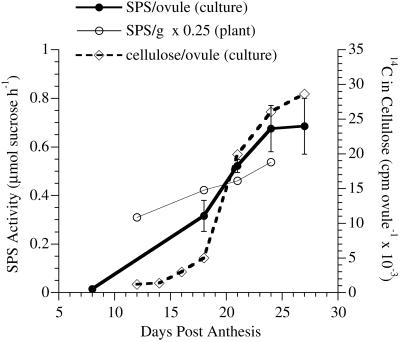
Figure 2.
Changes in SPS activity compared with the rate of cellulose synthesis during cotton fiber differentiation. Data are shown for the SPS activity in cultured fibers (normalized per the amount of fibers on one ovule) with error bars showing se of the means from each separate extract. Data for plant-grown fibers were normalized per gram of fiber and multiplied by 0.25 to achieve a better match with the y axis scale from cultured fibers. In this case, error bars representing se of the means from each separate extract are not visible. A graph of the cellulose synthesis rate in cultured fibers (normalized per the amount of fibers on one ovule) is included for comparison to the SPS data from cultured fibers. The graphs of SPS activity are adapted from figures in a thesis (Tummala, 1996). The graph of cellulose synthesis rate is adapted from a figure in a dissertation (Martin, 1999), and it has also been published elsewhere in combination with other data (Haigler et al., 2001).

