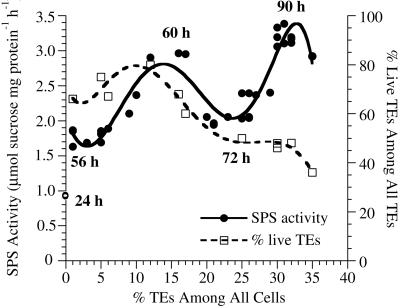
Figure 3.
Changes in SPS activity and the percentage of live TEs throughout the time course of TE differentiation in complex medium. SPS activity peaked two times corresponding to two successive waves of TE differentiation. Although the total percent TEs increased throughout the time course, around 60 h the first peak in SPS activity correlated with a first peak in the percentage of living TEs. Autolysis of the first differentiated TEs occurred by 72 h, when a lower level of SPS activity was observed. As additional large TEs differentiated after 72 h in complex medium (see Fig. 4), another peak in SPS activity occurred. As those TEs began to autolyze, the SPS activity declined (see data for 35% total TEs). Here and in Figures 5 and 6, the mean of three replicate assays for SPS activity (and percent living TEs, if applicable) is presented as one data point. se of the means for SPS activity are omitted to increase clarity of the graphs; they averaged about 4.3% of the mean.

