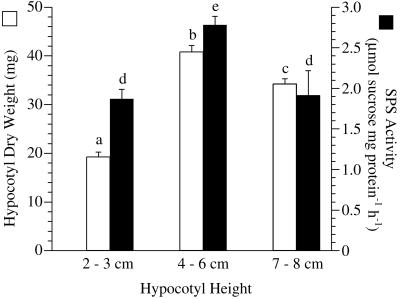
Figure 7.
Changes in SPS activity (black bars) and dry weight (white bars) over the time course of elongation in etiolated bean hypocotyls. Hypocotyls in three height classes, 2 to 3 cm, 4 to 6 cm, and 7 to 8 cm were analyzed. Histogram bars represent the means of six separate determinations containing three hypocotyls each, and error bars are se of the mean. a through c and d, e, Significantly different groups for hypocotyl weight and SPS activity, respectively. Significance was established by P < 0.001 in both cases, and the test statistic, F, was 86.01 for hypocotyl weight (n = 36 in each group) and 25.19 for SPS activity (n = 6 in each group).

