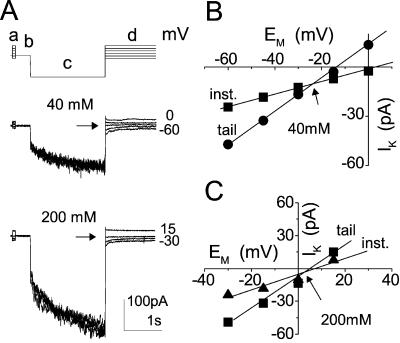
Figure 9.
Determination of reversal potentials by the “tail current” method. A, Pulse protocol (top) elicited inward currents from a flexor cell at [K+]O of 40 and 200 mm (superimposed records, middle and bottom). a and d, Varying pre- and test- pulses; b, holding potential; c, the main prepulse. Numbers at the right are the membrane potentials during the corresponding test pulses. Arrows mark the level of current at the reversal potential. Solutions used: bath, b or c with pipette f. B and C, I-EM relationships of the instantaneous (inst.) currents in A, sampled during a (▴) and the zero-time tail current sampled at the onset of d (▪), at the indicated [K+]O. Arrows mark the reversal potential of the time-dependent current, Erev, −24 mV at 40 mm and +5 mV at 200 mm.

